Molecular Fingerprints: Implementation of a pairwise distribution based molecular representation
I love benchmarks.
I love understanding how well new methods and protocol perform against previous methods (because this is the easiest way to measure how innovative your formalisms, architecture, and technologies are).
However, determining the robustness of a method against other methods is usually closer to the ‘downstream’ or final stages of a workbench simulation process investigating dynamical properties of a molecular system. The precursor to any sort of benchmarking or validation of a method on a particular model involves analysis of the system with respect to its varying parameters. With the case of our benchmarking and phase-space sampling studies, molecular configuration and orientation should be closely analyzed. Thus, for our large sets of data, this involves utilizing automated and robust structure comparison methods in order to assess the robustness of a set of configurations by assigning some sort of quantitative value through the use of a similarity metric.
Ideally, a similarity measure should be able to:
- provide an index value that ranks structures/configurations of a molecular system based on their similarity with a minimal overlap - providing a high degree of resolution between clusters of structures.
- provide an intuitive visual interpretation.
- be robust, relevant and generalizable
When looking at biologically relevant similarity metrics utilized for proteins, methods generally fall into two classes: positional distance-based and contact-based. With regards to the first class (and the more popular), positional euclidean distance-based measures require super-positioning reference atoms (selection of appropriate super positioning is also not an easy task) in Cartesian space in order to minimize the distance between shared reference points/atoms. Typically, similarity in the superimposed configurations is measured using Root Mean Square Deviation (RMSD):
\[RMSD = \sqrt{\frac{1}{n}\sum_{i=1}^{n}d^{2}_{i}}\]where \(d_{i}\) is the distance between two atoms in the \(i\)-pair of all atoms \(N\) for comparison. However, RMSD provides an average of the distances between pairs of atoms, and as such can become dominated by the most deviated fragments. Another cause for concern with RMSD is the internal symmetry of the system. With systems of high degrees of symmetry, it becomes difficult to determine unambiguous atomic-pairings between configurations as some atoms within the structure are topologically equivalent to each other. This issue continues to plague scientists studying protein similarity through alignment and RMSD similarity metrics.
The second class, contact-based measures serve as an alternative to avoiding super-positioning atoms. Contact-based measures are determined by overall differences between the distribution of pairwise distances from one configuration to the next, rather than distinguishing between structures by averaging the pairwise distances between the configurations. When utilizing contact-measure methods, the general protocol is to assign a contact area difference (CAD) number as a similarity ranking measure to evaluate protein structures. In method, they determine the “contact strength” of two amino acid residues \(i\) and \(j\) within a protein as the overlap of van der Waals surface area of residue atoms \(A_{ij}\). This is done for all pairs of residues in the protein and the stored as elements in matrix \(\{A\}\). When comparing contact matrices for reference structure \(R\) to trial structure \(T\), the elements of the difference matrix between \(R\) and \(T\) will be:
\[\Delta A^{RT}_{ij} = (A_{ij}^{R} - A_{ij}^{T})\]Thus, non-zero elements in \(\Delta A^{RT}\) will provide information about differences between fragment \(R\) and \(T\) in regards to specific residue pairs \(i\)-\(j\). This representation of contact differences between fragment \(R\) and \(T\) can then be represented as a single CAD number of the total unnormalized contact errors as:
\[\Delta A = \sum_{i,j}|(A_{ij}^{R} - A^{T}_{ij})|\]However, a variant to contact-based differences is Cosine-Similarity that is popular for document similarity in text analysis. Like CAD similarity measure, Cosine-Similarity measure factors in non-zero matches between the trials \(A^{R}\) and \(A^{T}\) and measures the similarity between the inner product space of two vectors by determining the angle between the two vectors:
\[Cosine-Similarity = \frac{A^{R} \cdot A^{T}}{||A^{R}|| ||A^{T}||}\]where \(A_{R}\) and \(A_{T}\) correspond to a reference vector and trial vector, \({||A||}\) the euclidean norm of vector \(A = (a^R_1, a^R_2,...,a^R_i)\), \(||A_{T}||\) the euclidean norm of vector \(A_{T} = (a^T_1, a^T_2,...,a^T_j)\). Thus, as cosine-similarity computes the angle between vectors \(A_{R}\) and \(A_{T}\) indicating whether the vectors are alike (cosine-distance = 1) or dissimilar (cosine-distance = 0). Thus, the closer the cosine value to 1, the smaller the cosine angle between two vectors, and the greater the match between vectors. Normalization of the Cosine-Similarity values:
\[Cosine-Distance = 1-2\cos^{-1}(\frac{A^{R} \cdot A^{T}}{||A^{R}|| ||A^{T}||})\]provides the angular similarity or Cosine-Distance functional between vectors as a distance metric between vectors that provides a more intuitive ordering of similarity from structure to structure. Thus, in the search for an appropriate similarity measure to analyze and categorize similar and dissimilar structures in an automated fashion, we have chosen to examine RMSD and Cosine-similarity distance metrics on two representative methods of chemical configurations: Cartesian- based distance matrix and Pairwise Radial Distribution Functional (PRDF)- based distance matrix.
Fingerprinting However, the ability of similarity measure to capture the differences from structure to structure is also affected by the degrees of freedom of the chemical representation. For larger subsystems, these degrees of freedom are reduced into euclidean distance measures between arbitrarily designated center of masses. As such, we attempt to represent molecular structures as unique identifiers or ‘fingerprints’ using a intramolecular distance matrix representation and also contact-based matrix representation utilizing pairwise radial distribution functions. Using both representation, we test the ability of a general RMSD similarity measure and cosine-distance measure to rank ‘fingerprints’ in a visual representation that is intuitively interpret-able. We also present the technical python implementation for said conversion of chemically relevant Cartesian- space data structures to redundant internal coordinates as a distance-matrix representation and a pairwise radial distribution functional representation.
PRDF
One method for a contact-based matrix representation is to utilize a pairwise radial distribution function (PRDF). In this case the PRDF fingerprint for a molecular system is obtained by calculating pairwise radial atomic distribution distances that serve as structural signatures. Previous methods and implementations have already been utilized for material cartography to represent crystal structure subunits. Using this method for chemical fingerprint, it has been demonstrated to be able to (i) query large databases of materials using similarity measures, (ii) map the connectivity of materials space (i.e., as a materials cartograms) for identifying regions with unique trends/properties. The goal of this implementation is to provide an accurate method for chemical search queries for a EFP parameter database. Here, we detail a python implementation for the derivation of a PRDF structural fingerprint for chemical system as defined in Cartesian space.
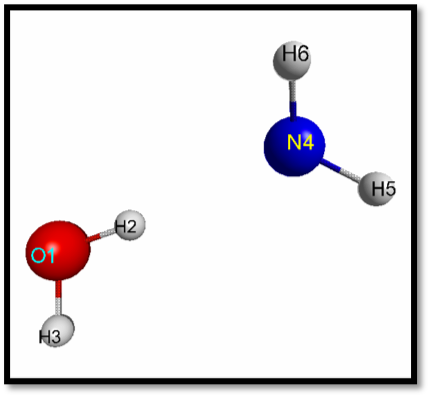
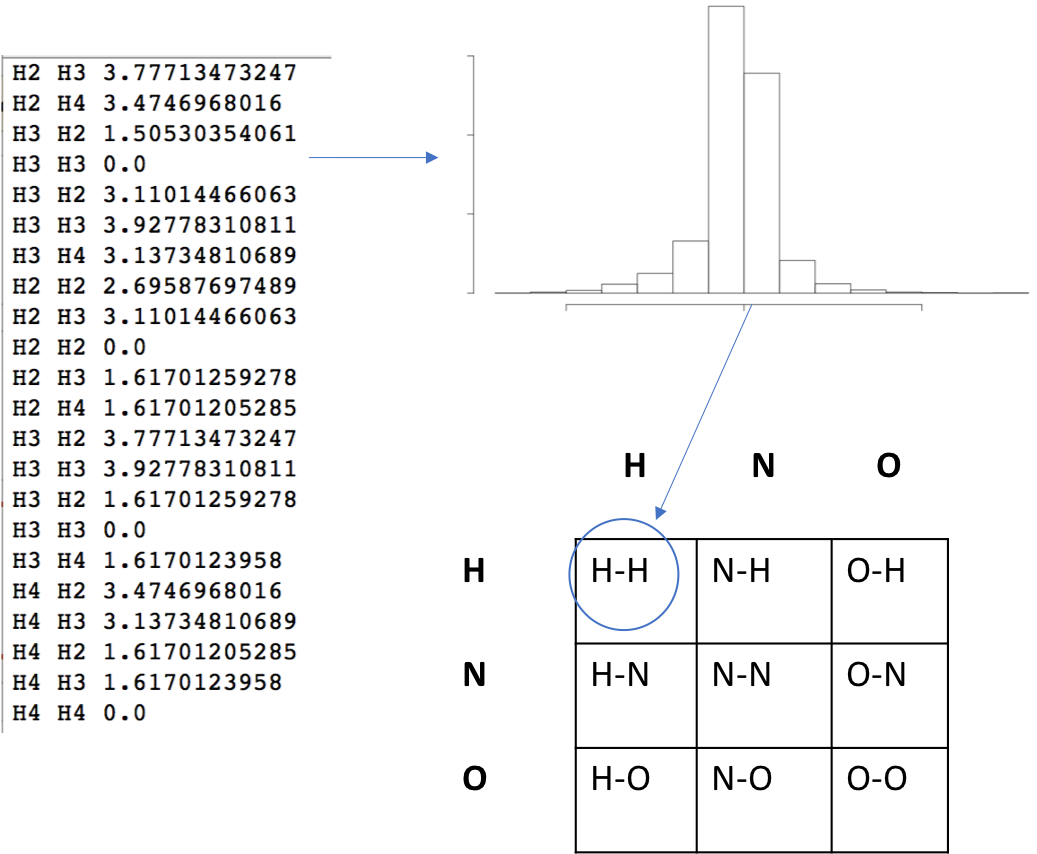
Technical Implementation From data science perspective, these molecules are just data structures represented as 4-dimensional arrays with inputs stored within a text file. Rows refer to instances of atoms with the floating types of the Cartesian coordinates in the x, y, and z direction. Using this type of representation, a distance matrix can be computed in a pairwise fashion between atoms within the system. Thus, for a \(H_{2}O\) and \(NH_{3}\) system shown below, a data structure would need to be initialized as a \(N\)x\(N\) array, where \(N\) represents the number of atoms. Each element within that array then will contain a list of pairwise distances specific to that particular atom-atom type.

In our current implementation, a distance matrix is computed and used to obtain a diagonal - the greatest distance between two atoms. This diagonal is used a threshold for normalizing pairwise distances and computing the particular density for each atom type. Then, a histogram of pairwise distances for two specific types of atoms are obtained iteratively for all elements in the array. In a general sense, each element in the array is a distribution described by:
\[F_{AB}(R) = \sum_{A_{i}}\sum_{B_{j}}\frac{R_{ij}}{4\pi R_{ij}^{2}(N_{A}N_{B}/V_{d})}\]where \(i\) iterates over all atoms \(N_{A}\) of type \(A\) within the molecular system and \(j\) runs over all atoms \(N_{B}\) of type \(B\). \(R_{ij}\) refers to the interatomic distance between atoms \(i\) and \(j\) and \(V_{d}\) volume of the molecular space. \(F_{AB}\) becomes a list of pairwise distances of type \(A\)-\(B\). This list of pairwise distances then is accumulated into a histogram of bin size 0.05 \(\unicode{x212B}\).

Once all of the histograms are obtained for each element in the array they are concatenated linearly to form a 2D dimensional array representing interatomic distances between pairs of atomtype (A) and (B) and the distribution of those distances. It should be noted that it is not possible to interconvert between atomic cartesian, distance matrix, and PRDF representations. This is due to the loss of information as one transforms the data from one type to the next.

The script to generate the cosine similarity using the PRDF representation is located here.
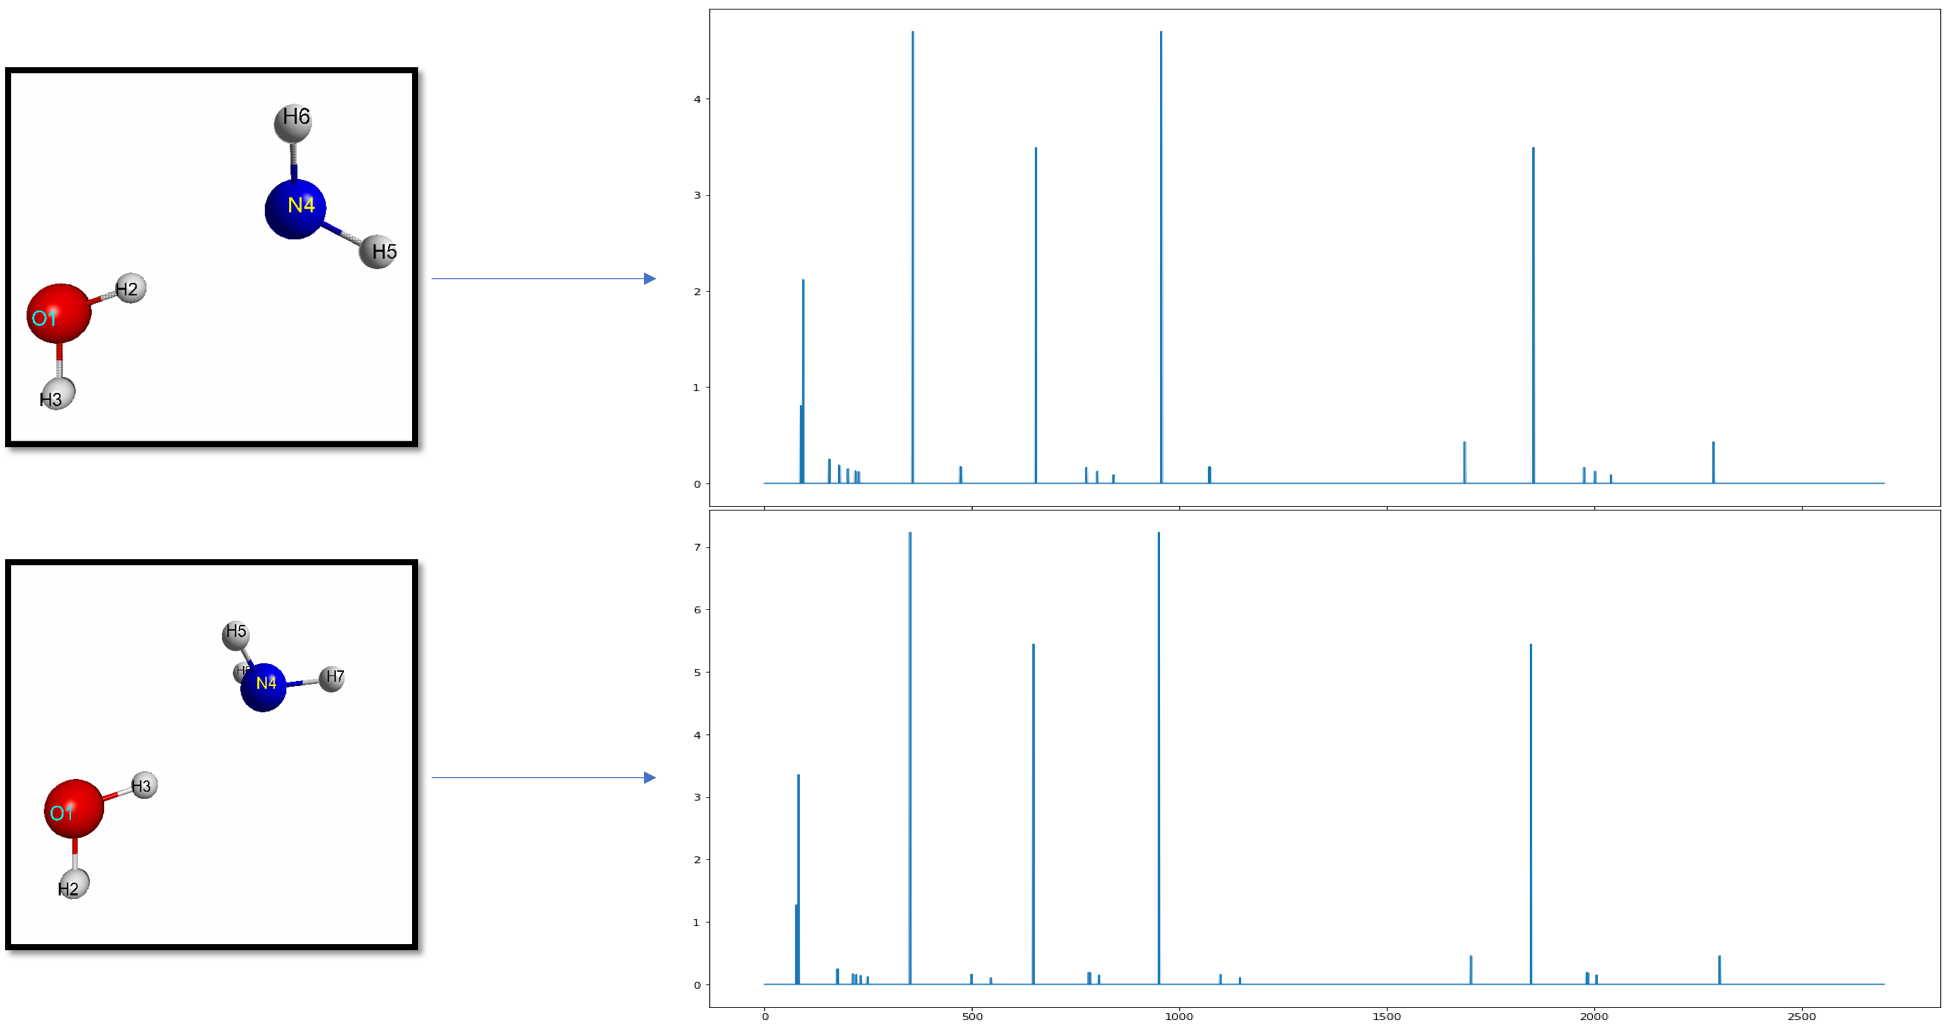
Below gives you an idea of the improved resolution using prdf representation versus the cartesian one:


